Introducing...
The 2022 State of the Reader Results
What is the State of the Reader?
The State of the Reader is our annual survey shining light on what makes readers tick. It's chock-full of valuable learnings — why we love to read, how we discover and choose books to read, who we read with, and more!
We're committed to fielding the State of the Reader each year because readers are at the heart of everything we do — so it's essential that we're keeping up with all your bookish experiences, high points, and needs. This is one of the ways we do that. And we're committed to sharing what we learn because there aren't many resources that illuminate who readers are today. While we could keep these juicy findings to ourselves, that's not who we are: we exist to support readers like you, and transparency is in your best interest. Put simply, Italic Type is reader-first. In all ways.
Just how many readers participated in our 2022 State of the Reader? More than eight hundred from all fifty states and all over the world. (That adds up to over 44,000 unique data points — whew!)
So without further ado, here's what we learned from our 2022 State of the Reader Survey!
(Curious about our methodology? Want to review respondent demographics? We've got you covered. You'll find those details at the bottom.)
Why we read in 2022
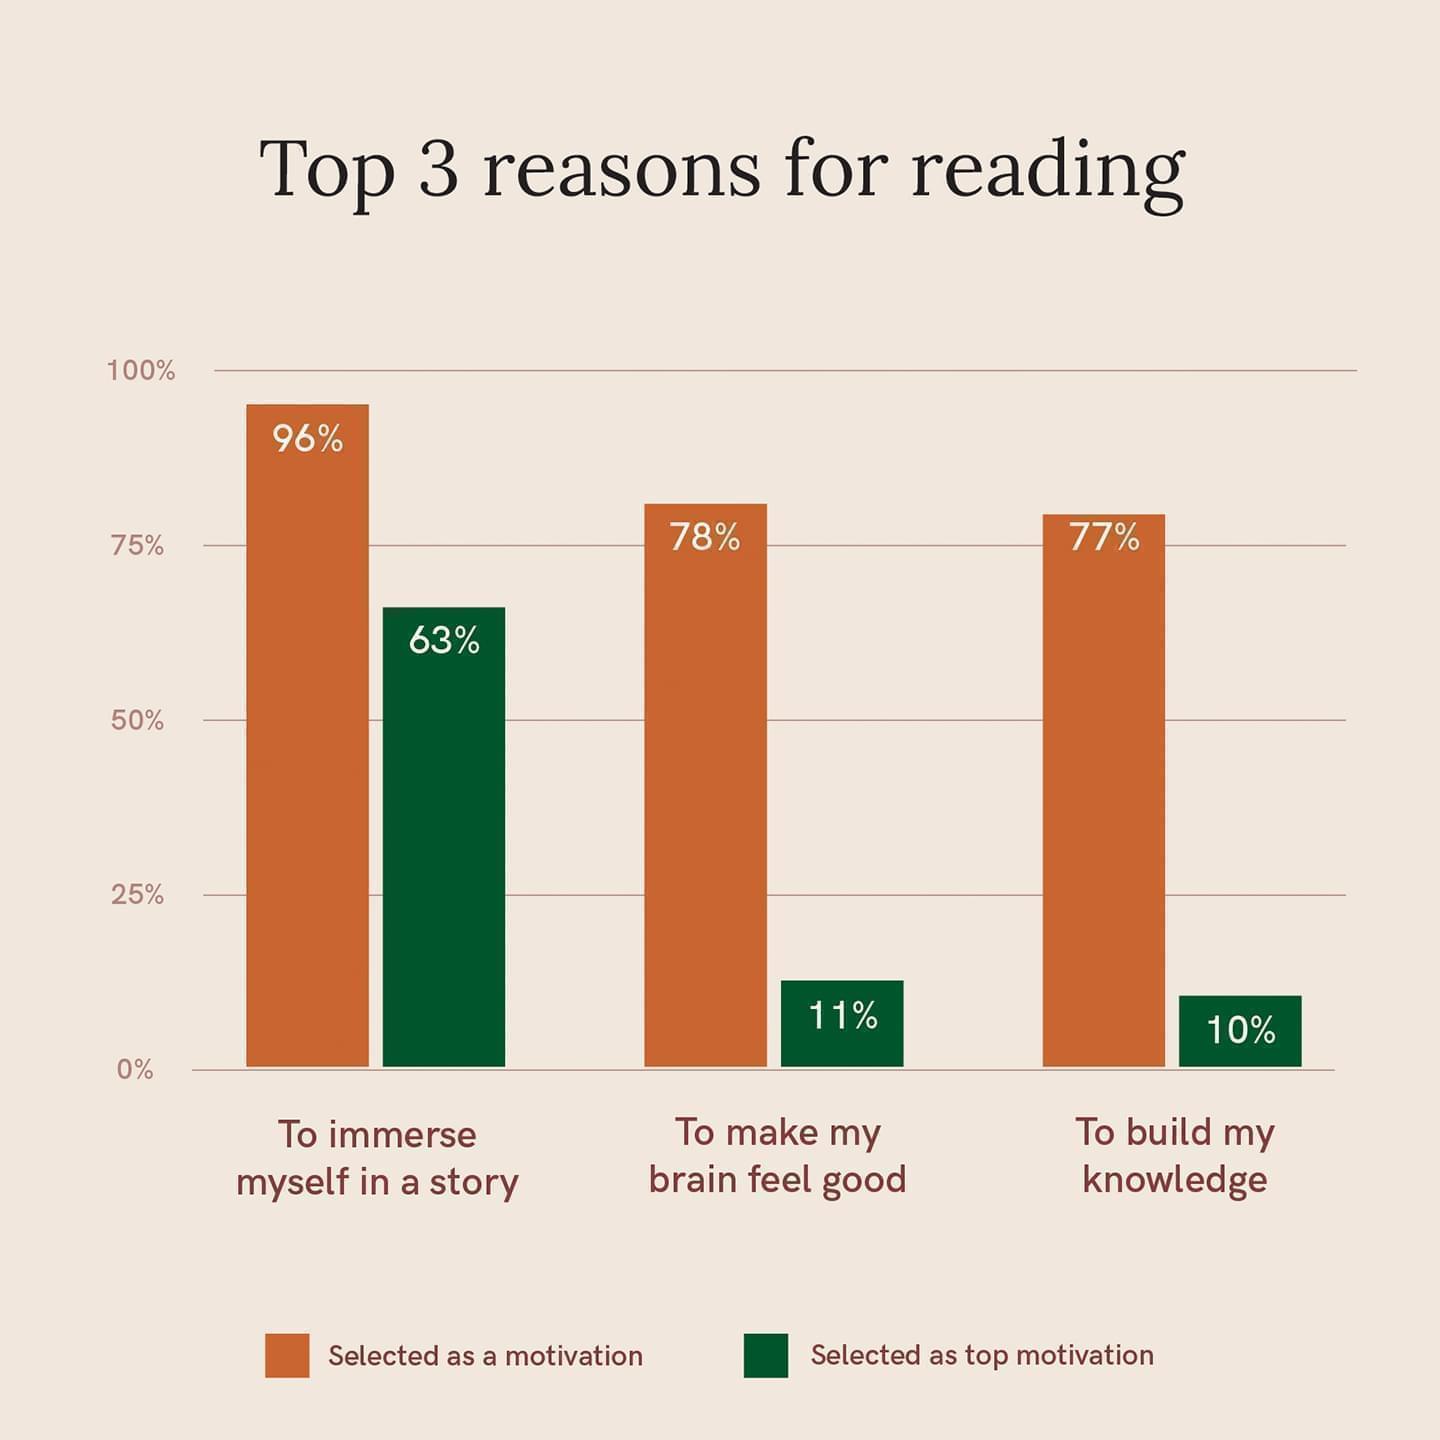
There are many things respondents loved about reading in 2022, but one motivation rose to the top: To immerse myself in a story. Learn about why escapism resonated, and more broadly, why we read in 2022.
Where our books came from in 2022
Recommendations were the most common – and beloved! – form of book discovery, but browsing bookstore and library shelves was a close second.
And speaking of bookstores, three-quarters of respondents who bought books got some or all of them secondhand. Learn more about where our books came from in 2022.
How we read in 2022
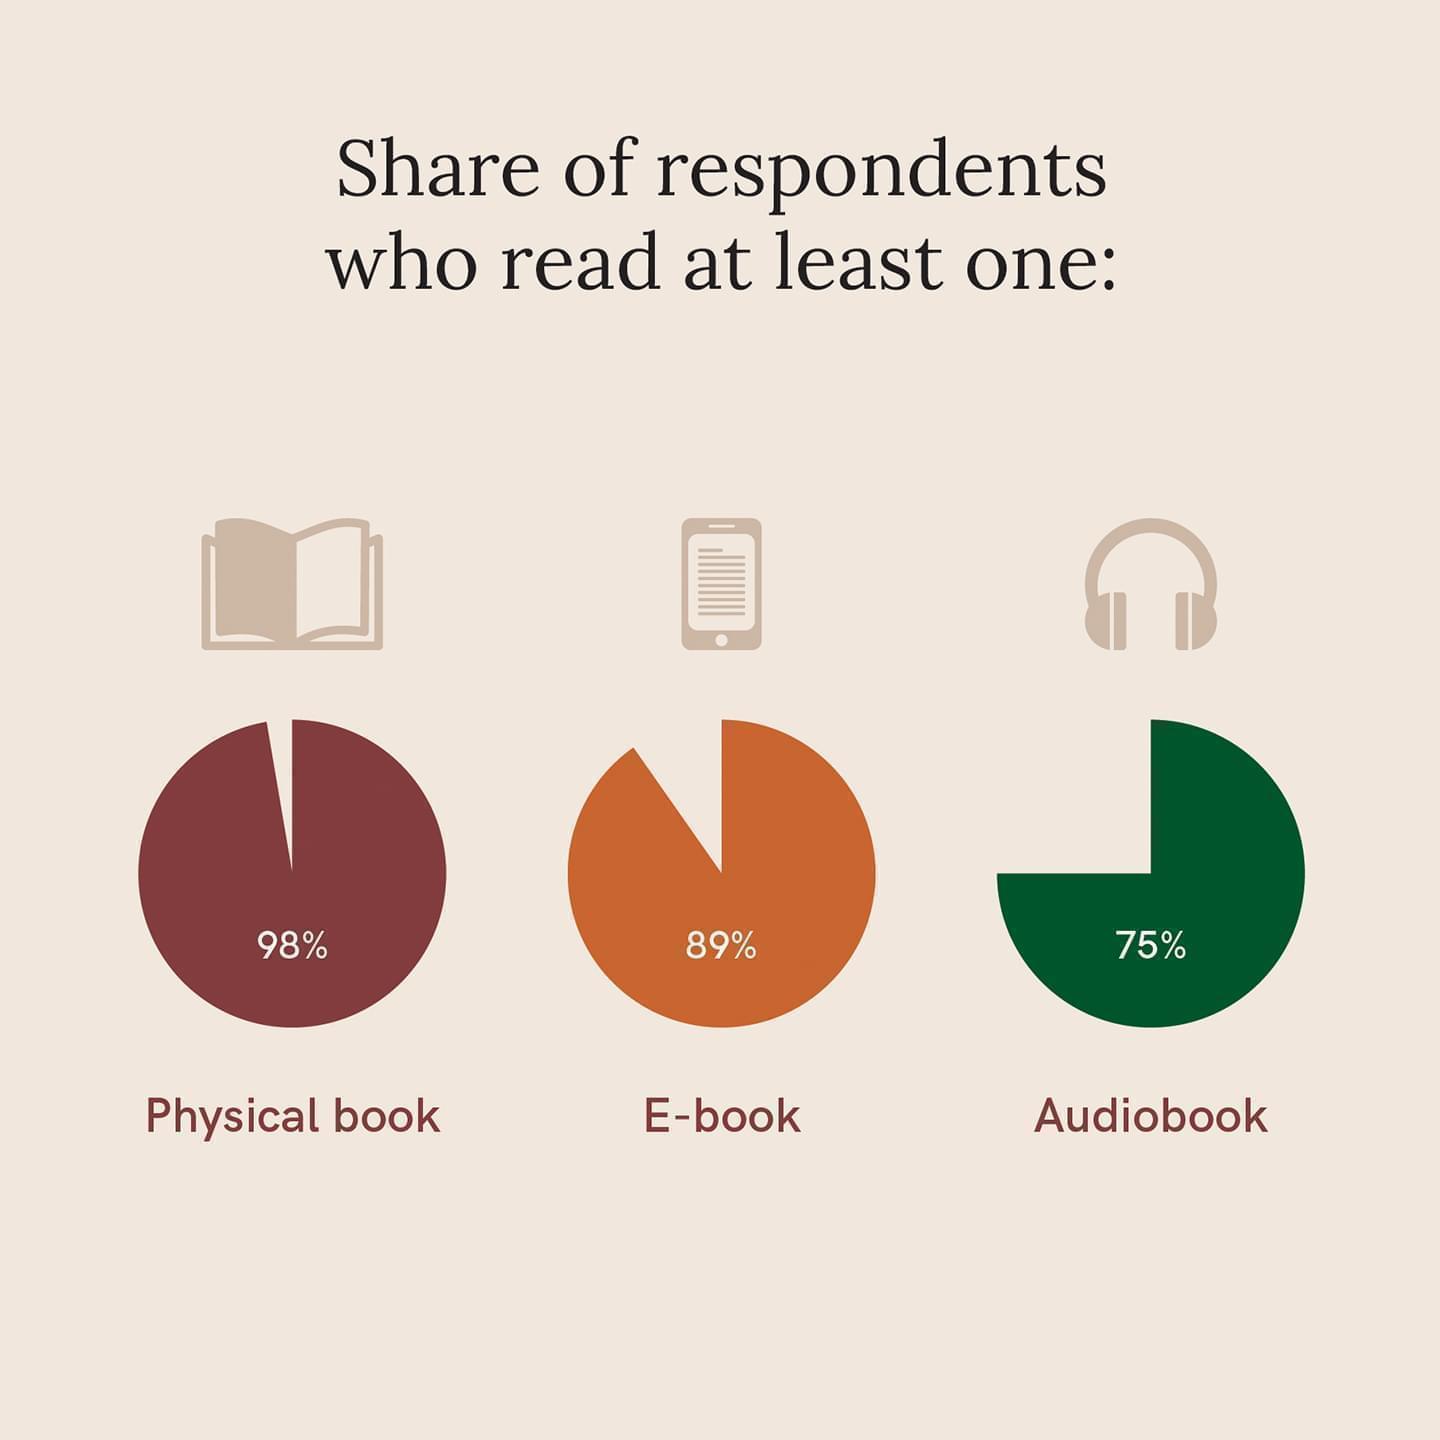
Respondents didn’t limit themselves to a single book format: nearly all mixed hard copies, e-books, and audiobooks.
Physical books remained the favorite for their tactility and "shelf presence," but e-books and audiobooks triumphed on convenience and accessibility. Learn more about how we read in 2022.
Tracking our reading in 2022
Nearly all respondents recorded their reading in 2022 through official apps, custom tools, social media platforms — or a combination of all three. Learn more about how we tracked our reading in 2022.

Who we read with in 2022
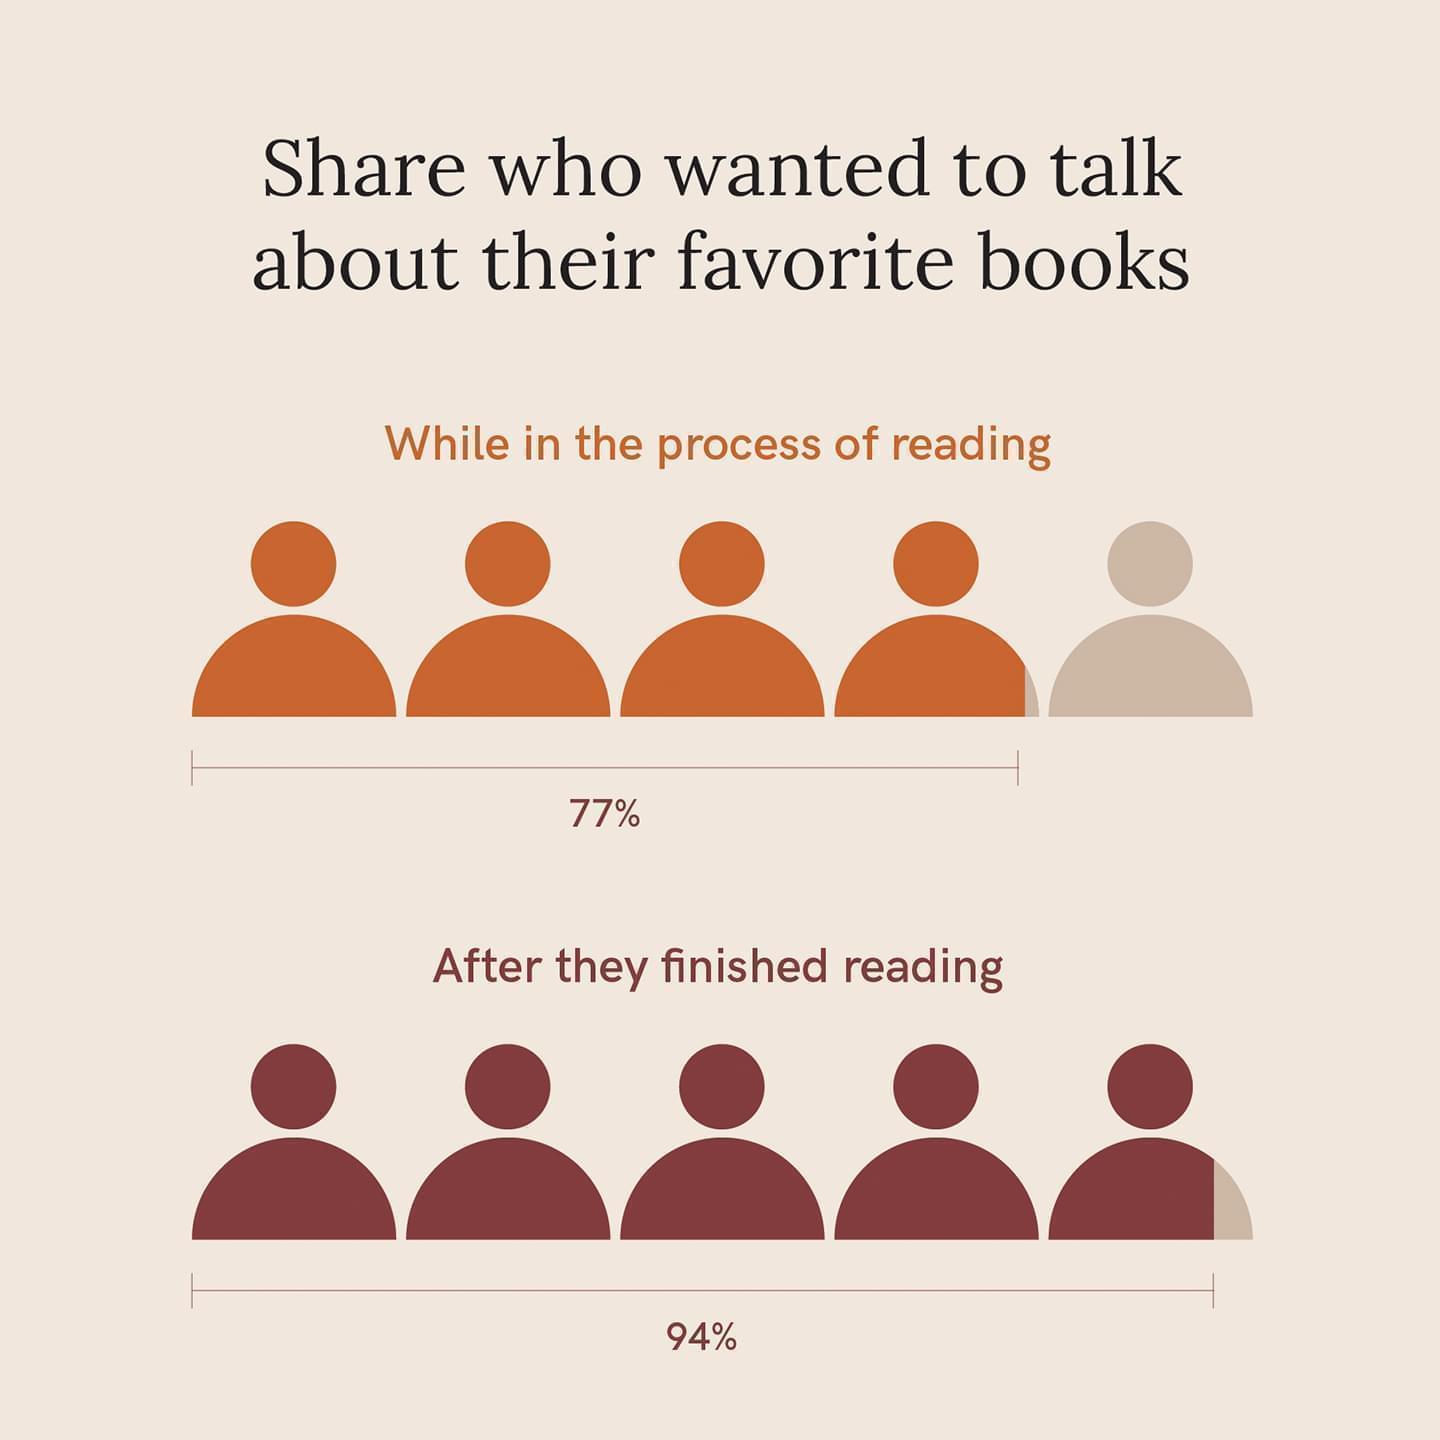
What's better than falling in love with a book? Having someone to talk to about it! Nearly all respondents felt that having someone to discuss and debrief with elevated their reading experience. Learn more about who we read with in 2022.
Reflections on reading in 2022
Four qualities stood out among the respondents who felt most satisfied with their reading in 2022:
- Flexibility with their reading goals.
- Confidence in their reading preferences.
- Willingness to give up on a book.
- Reading out of desire, not obligation.
Learn more about reflections on our reading in 2022.

Curious to see what's changed from last year? Review our findings from last year's State of the Reader.
Read nowWhy conduct the State of the Reader survey?
The State of the Reader survey is a lot of work — crafting and testing it, promoting it, fielding it, and, of course, analyzing the 44,000+ unique data points generated by 800+ respondents (though we happen to think that's the fun part!).
You might wonder why we dedicate all that time and energy.
It's a reasonable question — as a small and scrappy start-up, we're not exactly twiddling our metaphorical thumbs. But we believe the State of the Reader survey is a valuable use of our limited resources, and we're committed to continuing it year after year.
Why? Two reasons. First, because at Italic Type, we're committed to putting readers at the center of everything we do. And to accomplish that, we need to deeply understand readers and their ever-evolving experiences. This is one of the many methods we employ to do that on an ongoing basis, alongside more qualitative approaches like exploratory interviews, concept tests, and user coffee chats
The second reason is broader. There aren't many resources that shine light on who readers are today. No one seems to be collecting this information, let alone sharing it — so we've stepped up. And while we could keep these learnings to ourselves, that's not who we are. We exist to support readers. So we're accountable to readers. And transparency is in readers' best interest.
Put simply, Italic Type is reader-first. In all ways.
Methodology
This research wasn't based on random sampling, the gold standard in the survey world, so we want to be 100% clear about our process — how it was crafted, fielded, and who responded.
We started by reviewing our learnings from last year's State of the Reader survey — both on a conceptual and a meta level. What did we wish we'd asked differently, or asked at all? We thought carefully about how we could build on and expand what we'd learned, while guarding against confirmation bias.
We then drafted the survey and piloted it with about ten readers. We wanted to be sure the questions made sense, the flow ran smoothly, and it didn't take too long. We made adjustments based on their feedback.
Once we were ready to launch, we reached out to some friends for help promoting — a special thank-you to PangoBooks, Sara (@fictionmatters), Tessa (@thelithomebody), Hunter (@shelfbyshelf), and Brittany (@brittanysbookclub)!
Of course, we also promoted it ourselves. We emailed our Italic Type user base inviting them to participate, and also shared the survey on our own social channels.
We also invited everyone who took the survey to send it to other readers — with the incentive of an additional entry into our Bookshop.org gift card raffle for every referral.
This approach, known as convenience sampling, means the data we obtained is representative of the respondents we heard from — in other words, we don't have the ability to generalize to the broader population. (That's not to say that our findings are definitely not representative — we just can't assume they are.)
We launched in mid-January. In two weeks, we received 803 complete and unique responses — more than three times as many as last year!
Demographics
Eighty-nine percent of respondents lived in the US — hailing from all 50 states! Internationally, we heard from readers in twenty-six different countries, spanning every continent (except for, understandably, Antarctica).
While respondents ranged in age from younger than 18 to older than 65, three-quarters (75%) were between 25 and 44.
Ninety percent identified as women, 9% as men, and 1% as non-binary or gender non-conforming.
Eighty-seven percent identified as white; 6% as Hispanic, Latino, Latina, or Latinx; 6% as Asian or Asian American; 2% as Black or African American; 2% as multi-racial; and 1% as Middle Eastern or North African. (Note: These percentages sum to greater than 100% because respondents selected all that applied.)
While this survey isn't intended to be broadly representative — again, convenience sampling! — it's clear that the folks we reached this year are disproportionately white and female. While numerous sources have found that women are more likely to be readers than men (see Deloitte's meta-analysis for a timely summary), none have suggested that the gap is as extreme as what we've captured. And while the data are less clear on race/ethnicity and reading — especially due to confounding factors like socioeconomic status, early education, lack of representation in literature, and more — there's no evidence for that gap either.
As we continue to grow and learn how to best reach audiences that represent all readers — both through our State of the Reader survey and beyond — we commit to being more proactive in our outreach.
Have questions about our State of the Reader survey? Reach out to Christina, our CXO, at christina@italictype.com.